 Readings
of the WRM Course
Return to the Content of WRM course
Readings of the WRM Course
RDV Core Training Program FY98 Activity 2.2 Return to the Content of WRM course
WATER AS A SOCIAL AND ECONOMIC GOOD: HOW TO PUT THE PRINCIPLE INTO PRACTICE (1)
Agenda 21 and the Dublin Principles put the concept of water as an economic good on the global agenda, and have received wide acceptance by the world’s water professionals. However, there is substantial confusion about the exact meaning of some of the articulated principles. In particular, it is not clear to many non-economists what is implied by the statement that water is an “economic good” or an “economic and social good.” This paper addresses this lack of understanding by formulating the concept of water as an economic good and explaining in practical terms the economic tools that can be used to effect the environmentally, socially, and economically efficient use of water.
The potential role of economic tools in providing socially acceptable public decisions is not widely appreciated, particularly in many highly regulated situations. Furthermore, this paper suggests, contrary to the public perception, that with the improvement of the use of economic tools, the role for government regulation in managing water as an economic good is increased, not decreased.
The paper is divided into three sections following this introduction: Section 2 presents the general principles and methodologies for estimating costs and values in the water sector. In Section 3, some illustrative estimates of costs and values in urban, industrial and agricultural sectors are presented based on available data. Section 4 provides a summary of results and conclusions.
General Principles
There are several general principles involved in assessing the economic value of water and the costs associated with its provision. First, an understanding of the costs involved with the provision of water, both direct and indirect, is key. Second, from the use of water, one can derive a value, which can be affected by the reliability of supply, and by the quality of water. These costs and values may be determined either individually, as described in the following sections, or by analysis of the whole system. Regardless of the method of estimation, the ideal for the sustainable use of water requires that the values and the costs should balance each other; full cost must equal the sustainable value in use.
It may be pointed out that the value in alternative uses and opportunity costs are determined simultaneously when water supplies match water demands for user sub-sectors over time and space. Water markets, if functioning, will perform these functions of matching water demands (both for quantity and quality) with supplies if appropriate policies (regulatory and economic incentives) are used to take care of externalities. In the absence of such well-functioning water markets, efficient water allocations (and resulting values and costs) can be obtained by using multi-period, multi-location systems analysis models (Sinha, Bhatia, and Lahiri (1986); Anandalingam, Bhatia and Cestti (1992); and, Harshadeep (1995)). With the advent of high-speed computers and efficient software, it is now possible to obtain empirical estimates of values and costs using a systems analysis model on a personal computer.
However, where such systems analysis models are not available for the practical purposes of estimating values, costs and tariffs, a partial equilibrium approach should be followed. This requires estimating the opportunity cost of water when used in a particular sub-sector in order to reflect the cost to society of depriving other sectors of the use of this water. For example, while evaluating the full economic cost of water used in the industrial sector, it becomes necessary to estimate value in the best alternative foregone, which may be urban households or agriculture. Similarly, estimating the economic cost of water used in irrigation requires the estimation of the value of water used in the industrial and urban sectors. As illustrated below, there may be difficulties in estimating opportunity costs of irrigation water when irrigation accounts for 60 to 80 percent of the total water used.
Components of Full Cost
Figure 1 shows schematically the composition of the various components that add up to make the costs. There are three important concepts illustrated in this figure: the Full Supply Cost; the Full Economic Cost; and the Full Cost. Each of these is composed of separate elements that need further explanation.
Full Supply Cost
The full supply cost includes the costs associated with the supply of water to a consumer without consideration of either the externalities (5) imposed upon others nor the alternate uses of the water. Full Supply Costs are composed of two separate items: Operation and Maintenance (O&M) Cost, and Capital Charges, both of which should be evaluated at the full economic cost of inputs.
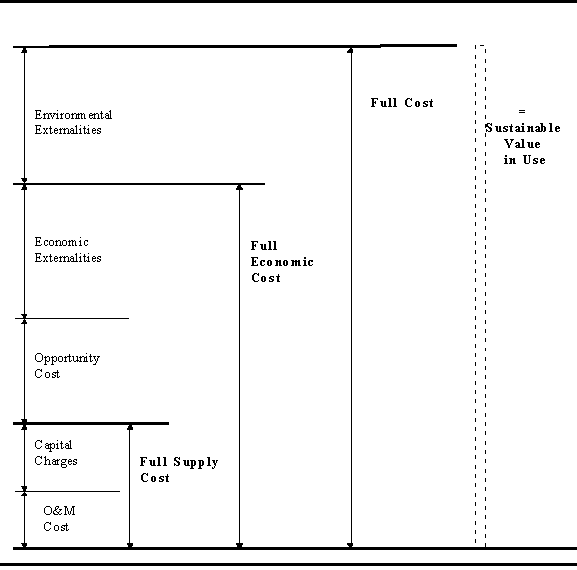
Figure 1. General Principles for Cost of Water
Capital Charges: These should include capital consumption (depreciation charges) and interest costs associated with reservoirs, treatment plants, conveyance and distribution systems. There is some disagreement about the calculation of capital charges (see Sinha and Bhatia, XXX, and Meier, XXX). Older methods use a backward accounting stance and look for the costs associated with repaying the historical stream of investments. Modern methods stress a forward looking accounting stance and look for the costs associated with replacement of the capital stock with increasing marginal costs supplies. These coupled with the O&M costs approximate the long run marginal costs.
Full Economic Cost
The Full Economic Cost of water is the sum of the Full Supply Cost as
described in the previous section, the Opportunity Cost associated with
the alternate use of the same water resource, and the Economic Externalities
imposed upon others due to the consumption of water by a specific actor.
Opportunity Cost:
This cost addresses the fact that by consuming water, the user is depriving
another user of the water. If that other user has a higher value
for the water, then there are some opportunity costs experienced by society
due to this mis-allocation of resources. The opportunity cost of
water is zero only when there is no alternative use; that is no shortage
of water. Ignoring the opportunity cost undervalues water,
leads to failures to invest, and causes serious mis-allocations of the
resource between users. The opportunity cost concept also applies
to issues of environmental quality, which are discussed in the further
in the paper.
Economic Externalities: As a fugitive resource (6) , water results in pervasive externalities. The most common externalities are those associated with the impact of an upstream diversion of water or the release of pollution on downstream users. There are also externalities due to over-extraction from, or contamination of, common pool resources (7) such as lakes and underground water. There may also be production externalities due, for example, to the agricultural production in irrigated areas damaging the markets for upland non-irrigated agriculture, or forcing them to change their inputs. The standard economic approach to externalities is to define the system in such a way as to "internalize the externalities." In this paper we have chosen to separate the economic and environmental externalities, realizing that in some cases it will be difficult to distinguish exactly between them. The externalities may be positive or negative, and it is important to characterize the situation in a given context and estimate the positive or negative externalities and adjust the full cost by these impacts.
(7) Common pool resources, such as village
commons, groundwater aquifers, and lakes are available for use to everyone
unless regulatory mechanisms exclude some persons or levy charges for their
use.
Negative Externalities, as discussed in Briscoe (1996), may impose costs on downstream users if the irrigation return flows are saline, or where return flows from towns impose costs on downstream water users. One method used to account for these externalities is to impose a salinity levy on users, depending on their water use patterns. This is used in the Australian state of Victoria and the surcharge is determined by the cost of restoring the saline water to its original condition (and is generally greater than the abstraction cost which users have to pay). Where return flows from towns impose costs on downstream users, one approach (in the German Ruhr and French systems, Briscoe, 1995) is to levy a charge on urban consumers for restoring the wastewater to an acceptable condition. These negative externalities should result in additional costs to users who impose these externalities on others.
Full Cost
The Full Cost of consumption of water is the Full Economic Cost, given above, plus the Environmental Externalities. These costs have to be determined based upon the damages caused, where such data are available, or as additional costs of treatment to return the water to its original quality.
Environmental Externalities:
We make a distinction between economic and environmental externalities.
The environmental externalities are those associated with public health
and ecosystem maintenance. Hence, if pollution causes increased production
or consumption costs to downstream users it is an economic externality,
but if it causes public health or ecosystem impacts, then we define it
as an environmental externality. Environmental externalities are
usually inherently more difficult to assess economically than the economic
externalities, but we argue that it is possible, in most cases, to estimate
some remediation costs that will give a lower bound estimate of the economic
value of damages. Methods of estimating these externalities are not
explored in this paper, but are discussed thoroughly in Dixon, et. al (1994),
Pearce (1976) and Winpenny (1991). We are now ready to assess the
other side of the question; the value of water.
Components of the Value of Water
For economic equilibrium the value of water, which we estimate from the value-in-use should just equal the full cost of water. At that point, the classical economic model indicates that social welfare is maximized. In practical cases, however, the value-in-use is typically expected to be higher than the estimated full cost. This is often because of difficulties in estimating the environmental externalities in the full cost calculations. However, in many cases it may be lower than Full Cost, Full Economic Cost, and even below Full Supply Cost. This is because often because social and political goals override the economic criteria.
The value of water depends both upon the user and to the use to which it is put. Figure 2 shows schematically the components of the Value-in-Use of water, which are the sum of the Economic and Intrinsic Values. As shown in the figure, the components of Economic Value are:
Value to Users of Water: For industrial and agricultural uses, the value to users is at least as large as the marginal value of product (8) . For domestic use, the willingness-to-pay (9) for water represents a lower bound on its value, as there is additional value to the water as described below. There are numerous studies that attempt to compute the marginal value of water use by industry and agriculture, and willingness-to-pay by domestic consumers (see, for example, Briscoe (1996); Gibbons (1986); Desvouges and Smith (1983), Griffin, et al. (1995); Singh, et al. (1992); Whittington, et al. (1987); World Bank (1995).
(9) For example, the willingness-to-pay
may be estimated by using "bidding games" where consumers indicate their
monthly payments for a given service.
Net Benefits from Return Flows: Return flows from water diverted for urban, industrial, and agricultural uses constitute a vital element of many hydrological systems, thus the effects of these flows must be taken into account while estimating the value and cost of water (Briscoe (1996); Seckler (1996); Sinha, Bhatia and Lahiri (1986)). For example, a part of the water diverted for irrigation may recharge the groundwater table in the region and/or increase the returns to the river/canal downstream. However, the benefits from the return flows will critically depend on the proportion of water that is “lost” to evaporation (due to open drains and canals) or to other “sinks.”
Net Benefits from Indirect Use: The typical example of these benefits occurs with irrigation schemes that provide water for domestic (drinking and personal hygiene) and livestock purposes which can result in improved health and/or higher incomes for the rural poor. For example, in areas of northwest India (Haryana and western Uttar Pradesh) where groundwater is saline, irrigation canals not only provide water for domestic and livestock uses, water in these canals recharge the groundwater table, thus enabling the pumping of water from handpumps and shallow tubewells. In the absence of this sweet water, use of saline groundwater by animals is reported to result in about a 50 percent reduction in the output of milk (Bhatia and Raheja (1986)). In many arid regions of Haryana, the Indian Punjab and the Pakistani Punjab, income from livestock accounts for a significant proportion of the income of poor households, particularly in the drought season. In addition to livestock, irrigation canals provide water for wildlife, flora and fauna and provide in-stream benefits. In some canals in South India, canal drops are known to be used for installation of small and mini hydro plants. These indirect benefits have to be included while estimating the value-in-use of water that is diverted for agricultural purposes. Ignoring these benefits could result in a serious under-estimation of societal benefits available from the volume of water that is diverted for irrigation. Irrigation is also known to have some adverse environmental and social impacts which result in hardships for poorer households. Such adverse consequences include, inter alia, waterlogging and salinization of soils, declining groundwater tables (which result in dry handpumps and shallow tubewells), and pollution of water from agrochemicals and water-borne diseases (Vaidyanathan (1993)). These environmental impacts can be adjusted either in terms of the negative benefits in estimating the value of water in agriculture, or added to the “environmental externalities” component of the Full Cost of water.
Adjustment for Societal
Objectives: For water use in the household and agricultural sectors,
there may be an adjustment made for societal objectives such as:
poverty alleviation, employment and food security (particularly in
rural areas, where foodgrain prices tend to be high in the absence of the
additional food output gained from irrigated agriculture, and where it
may be difficult to supply imported foodgrains). Such adjustments
are over and above the value of water to the user and should be added to
reflect various societal objectives, as described in the section on irrigated
agriculture. Extreme care must be taken in the use of these adjustments,
with full consideration of the alternatives to meet these goals.
The estimates of these values are not to be arbitrarily set, but should
be determined on the basis of the best available methods that give the
real gains to the society from price differentials among sectors.
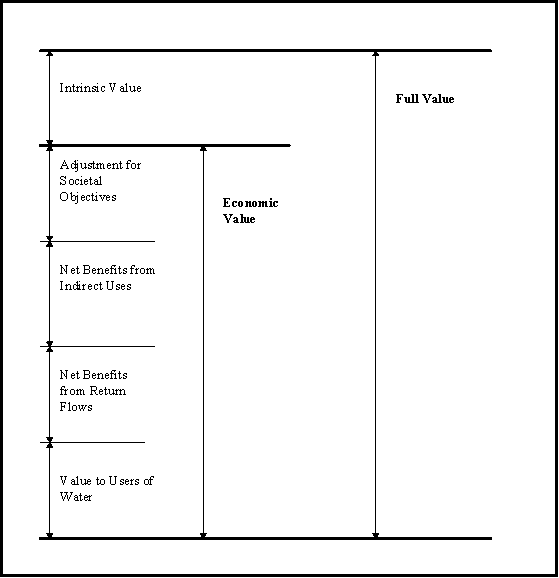
Figure 2. General Principles for Value-in-Use
The concept of economic value, it should be noted, does not assign any value to concerns such as stewardship, bequest values, and pure existence values. While these are difficult to measure they are, nevertheless, valid concepts and do reflect real value associated with water use (or non-use).
A comprehensive review of the different types of benefits occasioned by environmental management is given in Desvouges and Smith (1983). The benefits are split into the two major categories of "current user values" and "intrinsic values." The current user values themselves are split into two major categories of "direct" use and "indirect" use. In terms of Figure 2 these intrinsic values are generally difficult to define and estimate, but in some cases they could be considered as externalities of use of the resource, and hence, are relatively easy to incorporate. In other cases, for example with bequest value, they may always be difficult to locate in the conceptual scheme. One way to approximate intrinsic values is to estimate "hedonic price indices" associated with the consumption of goods and services. For example, Harrison (1973) estimated the price of housing based upon a regression of price on several economic, location, social, and environmental variables. In this way it is possible to relate the actual behavior to the desirability of various intrinsic values, such as a "water view," and "green vistas" associated with irrigation works, or instream flow and quality requirements.
Other Issues to be Considered
The Effects of Reliability of Water Supply on Cost and Value: The value of water depends crucially on the timing and reliability of the water supplies. Timeliness is most critical in irrigated agriculture where water shortages during critical stages of plant growth result in reduced crop yields. Lack of reliable irrigation supplies in public irrigation systems, particularly in South Asia, are responsible for low crop yields and farmers’ lack of willingness to pay the full cost of water. Pumping of groundwater (e.g. in Northwest India and Pakistani Punjab) improves timeliness and reliability of water input and, hence, has resulted in relatively higher crop yields. For example, in four Indian states (Punjab, Haryana, Andhra Pradesh and Tamil Nadu), land receiving groundwater irrigation produced roughly twice as much additional foodgrains per hectare as land receiving canal irrigation (Repetto (1994); Chambers (1988); Dhawan (1988)).
However, improving reliability and timeliness in water supplies entails higher costs in terms of additional storage capacity and/or pumping. For example, in the northwestern state of Haryana, where the irrigation charges for surface water supplies are less than US$10 per hectare per year, farmers are known to spend as much as US$90/ha/yr in irrigation costs. These irrigation costs account for as much as 20 percent of the net value of output from these crops and indicate that farmers’ willingness-to-pay (as well as actual payments) are quite high for timely and reliable water supplies for irrigation. Hence, those institutional and financing arrangements that ensure reliable water supplies are likely to be more sustainable for improving water use efficiency than those that concentrate only on cost-recovery.
Reliable and adequate water supplies are also critical for households and industrial users. High investment costs are incurred and high prices are paid by households as part of the coping strategies adopted in the face of uncertain water supplies (World Bank Water Demand Research Team (1993); World Bank (1995)). For example, poor people, especially in urban areas, often have to pay very high prices for obtaining adequate water supplies of acceptable quality (Bhatia and Falkenmark (1993)).
Reliable water supplies for industry and thermal power plants are critical for maintaining desired production levels. Since water for industrial and power purposes is also required during the dry season, provision of water for these users entails high opportunity costs as well as high supply costs. Providing reliable water supplies during dry season results in higher storage costs and higher evaporation losses in reservoirs and canals. These costs have to be taken into account while evaluating the benefits and costs of industrial water supplies. Further, the need to provide a given quantity to industry in dry season may result in lower area under irrigation when their peak water requirements coincide during a particular fortnight. This has to be factored in when calculating the opportunity costs of water in the industrial/urban sectors.
Water Quality Concerns in Cost and Value
As in the case of reliability, water quality influences both values and costs. The first 3 to 4 liters of water used for drinking purposes has to be of the best quality and provides high value to the consumer as well as to society. Water for bathing, washing and personal hygiene need not be of the same quality as that used for drinking and cooking purposes. Flushing of toilets, cleaning and gardening require varying qualities of water, resulting in differing levels of value, and hence willingness-to-pay. Industrial processes can use recycled water for process, cooling and for transporting waste materials. Similarly agriculture needs differing water qualities, resulting in differing values and costs of provisioning the water. In particular, the demand for various water qualities for different uses provides incentives for recycling and re-use of water, with a view to matching demands with supplies.
In this section we present some illustrative estimates for three primary water user sectors: urban households, industry and irrigated agriculture. These estimates are based on the best available data and are specific to the conditions and situations for which these estimates have been made. As stated in the Introduction, ideally these estimates would be generated on the basis of systems analysis, but in the absence of the resources necessary to do this, which is typical for most developing countries, we present here the next best alternative calculations. These empirical estimates are presented here with a view to raising methodological issues that will help in the operationalizing of the principle that water is a social and economic good. Estimates for ecological uses have not been presented in view of the methodological difficulties of quantifying these benefits and costs (Briscoe (1996); Goodland (1996); Gibbons (1986)).
Value and Cost of Water for Urban Households in Phuket, Thailand
Using the approach suggested in Section 2, Figure 3 presents estimates of costs and values for urban water supplies in the tourist resort of Phuket in Thailand. Using the data provided in Patmasiriwat, et al. (1995), the O&M costs have been estimated as $0.34 per cubic meter, which includes the cost of raw water ($0.24 per cubic meter). Capital charges for the distribution system have been estimated as $0.24 per cubic meter, giving a Full Supply Cost of $0.58 per cubic meter. Since there are no alternative uses of this water in agriculture or industry, (the island is almost exclusively a tourist area) the opportunity cost is taken as zero and the Full Economic Cost is equal to the Full Supply Cost.
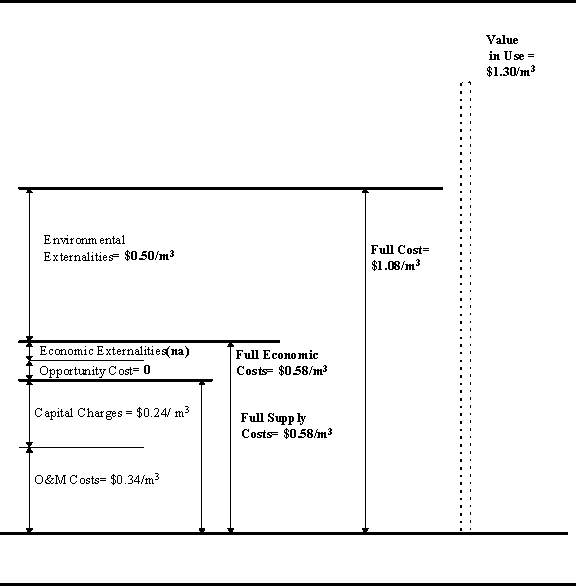
Figure 3: Costs and Values for Urban Water Supply in Phuket, Thailand (10) (11) (12) (13)
Environmental externalities are taken into account by estimating the costs of wastewater treatment at $0.50 per cubic meter. Thus, the Full Cost is estimated at $1.08 ($0.58 plus $0.5) per cubic meter.
The Value-in-Use ($1.30 per cubic meter) has been estimated from data on the willingness-to-pay of urban consumers and hotels for vended water during the summer months. This value is relevant for three summer months when there are extreme shortages of water. It may be mentioned that this estimate of the value-in-use is much higher than what the urban consumers indicated in a Willingness-to-Pay survey carried out in Phuket.
The gap between the value and costs implies a problem with sustainability in Phuket, or the need for more evaluation of the estimates given above. Some of the problems may arise because of the relative inaccessibility of the resource to alternate uses. The gap may also indicate a need for storage. [IT MAY BE INTERESTING TO STATE HEAR WHAT USERS IN PHUKET PAY FOR WATER—DO WE KNOW THIS?]
Value and Cost for Irrigated Agriculture in an Arid Zone: Haryana, India
Estimation of the Economic Value of water in irrigated agriculture involves computing the three components as illustrated in Figure 4. The monetary returns from water in irrigated agriculture vary tremendously across crops and agro-climatic regions, and depend critically on the timing of application of water and the level and efficiency of use of inputs other than water. Positive economic externalities include health and income benefits from the use of irrigation water for the purposes of drinking, personal hygiene and for livestock. Net benefits should also be estimated from the return flows from irrigation. The detailed methodology of estimating these components along with an illustrative exercise is discussed below.
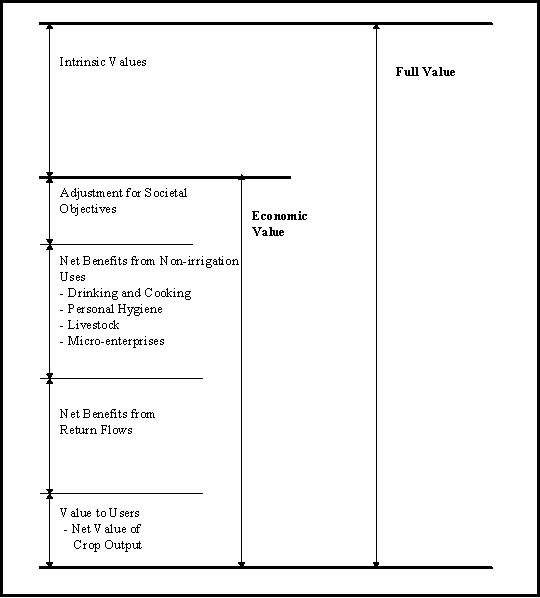
Figure 4. Estimation of Value of Water in Irrigated Agriculture
In view of the low rainfall in this arid region, and high evapotranspiration needs of crops, the amount of irrigation water diverted is very high from both surface irrigation and groundwater. The estimates of irrigation requirements for Haryana are: 1640 mm/ha for paddy and 420 mm/ha for wheat (Dhawan (1988)). This is equivalent to 16,400 cubic meters of water diverted for paddy and 4,200 cubic meters of water diverted for wheat--i.e. a total of 20,600 cubic meters of water per year. Given the crop output of 2.9 tons of rice and 3.6 tons of wheat (Table 1), these figures show that about 20.6 tons of water diverted for irrigation in a year resulted in a foodgrain output of 6.5 tons--i.e. a ratio of a little over three to one. However, this figure will be lower when return flows are taken into account as discussed below.
Table 1. Estimates of Additional Net Value (14)
of Output in Agriculture (15) in
Haryana,India
| Value of Output with Irrigation | Value of Output without Irrigation | Additional Value/Costs | |
| Gross Value of Output (US$ /ha/year) | 1290 | 220 | 1070 |
| Cost of Cultivation (16) (US$/ha/year) | 870 | 190 | 680 |
| Net Value of Output (US$/ha/year) | 420 | 30 | 390 |
| Estimated Water Input (m3/ha/yr of water diverted) | 20,600 | 0 | 20,600 |
| Net Value of Output per Unit of Water Input (US cents per cubic meter) | 1.9 |
Net Benefits from Non-Irrigation Uses: As discussed earlier, irrigation water may provide significant additional benefits from its use in drinking, cooking, bathing, or livestock. There are no empirical studies that quantify the additional value of these benefits in Haryana. In the absence of such data for Haryana, an estimate of 1.0 cent per cubic meter is used for additional benefits to the value of water diverted for irrigation. In cases of uncertainty such as this, a sensitivity analysis should be done to evaluate the effects of over- or under-estimating the true indirect benefits.
Net Benefits from Return Flows: A part of the return flows in Haryana go to a “sink” of saline groundwater while the rest recharges the groundwater. Although water tables in Haryana have been declining, mining of groundwater is occurring only in one or two districts. Hence, on average, it is assumed for illustrative purposes only that net benefits from return flows are 25 percent of the net value of output in agriculture, based on the volume of the recharge. This gives an estimate of 0.5 cents per cubic meter of water diverted for irrigation purposes.
Total Economic Value in Irrigated Agriculture: The estimated total economic value of water diverted to irrigated agriculture is estimated at US 3.4 cents per cubic meter (Figure 5), based on the sum of the three components described above.
Full Economic Costs: The Full Economic Costs of water diverted for agriculture, based on the data available for Haryana, are the sum of: US 0.2 cents for O&M costs; 3.8 cents per cubic meter for capital costs; 1.5 cents per cubic meter for pumping (O&M) costs; and, 3.0 cents as opportunity cost of water (from urban household use). These components (Figure 5) add up to 8.7 cents as the Full Economic Costs of supplying water for irrigation in Haryana. The gap between the costs and values clearly indicate the lack of sustainable use.
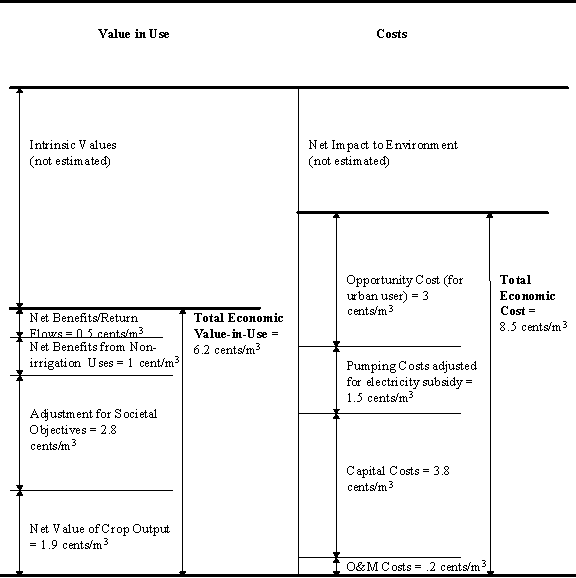
Figure 5. Estimation of Value-in-Use for Irrigated Agriculture and Costs of Water in Haryana, India (Note)
Note: For details of value to users, see Table 1.
In this section we present estimates of costs and values of water used in agriculture, industries and urban households near Jamshedpur in the Subernarekha river basin in eastern India. These data are based on field surveys which were carried out in 1991 and 1992 to estimate willingness-to-pay, cost of conserved water and the cost of water treatment by industry and municipalities for recycling and reuse (Bhatia, et al. (1994)). For this river basin, we have data and results based on partial equilibrium approaches as well as the use of systems analysis models (Anandalingam, Bhatia and Cestti (1992); Harshadeep (1995)).
Value of Water in Irrigated Agriculture in the Subernarekha River Basin
The estimated net value of output with irrigation (over that without irrigation) was US $244 per ha in 1991-92. In this region, water requirements for irrigation have been estimated to be 8,800 cubic meters per ha per year, reflecting relatively lower evapotranspiration needs and higher rainfall (as compared with Haryana). Thus, the net value of output in agriculture in this region is estimated at 2.7 cents per cubic meter of water diverted, about 45 per cent higher than that in Haryana.
Net Benefits from Non-Irrigation Uses: Similarly, we use the same estimate as for Haryana of 1.0 cents per cubic meter for the additional benefits to the value of water diverted for irrigation.
Net Benefits from Return Flows: It is assumed (for illustrative purposes as with those for Haryana) that net benefits from return flows will be about 25 percent of the net value of output in agriculture. This gives an estimate of 0.7 cents per cubic meter of water diverted for irrigation purposes.
Total Economic Value
in Irrigated Agriculture: The estimated total economic value
of water diverted to irrigated agriculture is estimated at US 4.4 cents
per cubic meter (Figure 6), based on the sum of the above quantities.
Full Economic Costs: Full Economic Costs of water diverted
for agriculture are the sum of: 0.2 cents for O&M costs, 3.8
cents for capital costs, 1.5 cents for pumping (O&M) costs, and 59.5
cents for the opportunity cost of water (based on the value to urban household
and industrial uses, determined below), for a total of 65 cents (Figure
6).
Value and Costs of Water in Urban and Industrial Sectors
It may be noted that Full Supply Costs at 6.6 cents per cubic meter
in Jamshedpur are relatively lower than those in Phuket, Thailand, because
in Jamshedpur the industrial users can pump water from the river and the
costs of pumping, conveyance and distribution are relatively low.
The industries as well as urban consumers can also obtain supplies from
a reservoir (the Subernarekha dam) during summer months and there are economies
of scale in storage costs of water on account of the large irrigation demand
(which is twice the demand for water in urban and industrial uses).
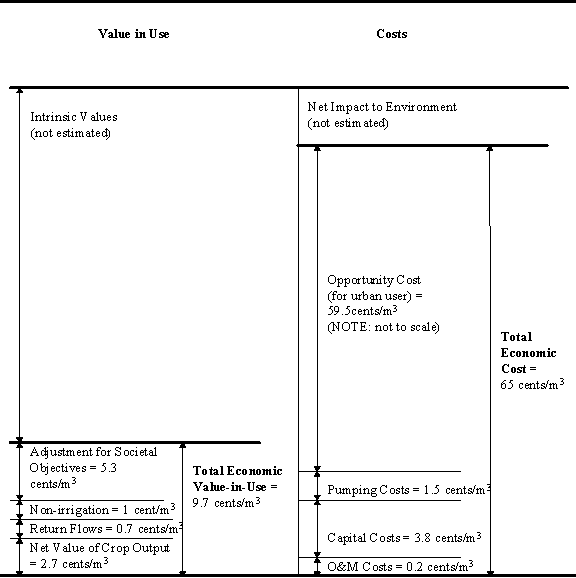
Figure 6. Estimation of Value-in-Use for Irrigated Agriculture
and Costs of Water in Subernarekha River Basin, India
The effects of economic externalities have been nominally estimated to be 1.4 cents per cubic meter to reflect the water withdrawal impacts on downstream users (other than those captured by the opportunity cost, i.e. benefit foregone in irrigation). [CAN WE EXPLAIN THIS MORE?]
The environmental costs have been represented by the cost to treat water to its original quality, estimated to be 14.5 cents per cubic meter at 1991-92 prices (Bhatia, et al. (1994)). Treatment and reuse of wastewater from a power plant (containing flyash and coal particles) is estimated at 12.7 cents per cubic meter. The costs of treatment of wastewater from cokeovens and blast furnaces (containing high levels of phenol, ammonia and suspended solids) have been estimated at 45 cents per cubic meter of water (Bhatia et al. (1994)). We have taken a weighted average figure of 29 cents per cubic meter to reflect the cost of environmental externalities.
Using the above estimates of various components, the Full Economic Costs are estimated at 17.7 cents per cubic meter and the Full Costs at 46.7 cents per cubic meter. The value of water in urban households is estimated from the average Willingness-to-Pay in urban areas of Jamshedpur, which is 25 cents per cubic meter.
The value of water to industry is estimated at US$2.60 per cubic meter,
based on the average of the net value added per unit of water for the 21
industrial units for whom data were available. It may be noted that
this value is total net value of output divided by the volume of freshwater
water diverted for the industrial unit. It does not reflect the marginal
value of water to the industrial units. This is shown in Figure 7.
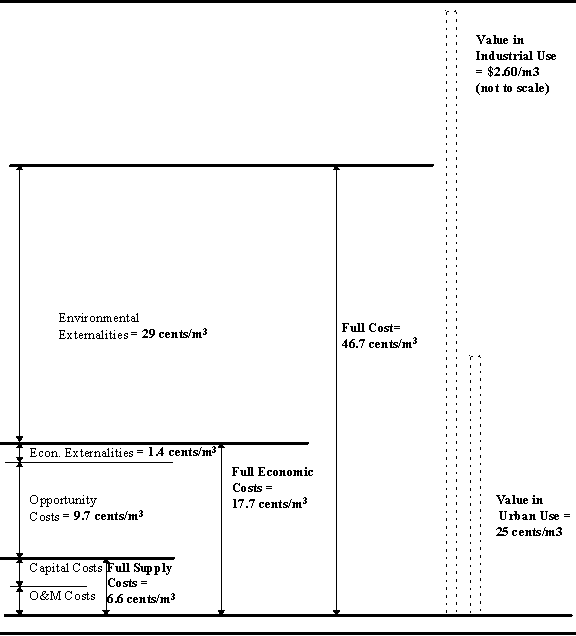
Figure 7. Estimation of Costs and Values for the Urban and Industrial Sectors Subernarekha River Basin, India
As mentioned earlier, users face the full economic cost when the price paid includes: (i) the supply cost (which includes O&M costs and capital charges) and (ii) the opportunity cost which reflects the value of water in its best practical alternative use. The opportunity cost of water used in irrigation would depend on the opportunities and costs of transferring the water among potential users of that water (which will usually include other farmers, and may include other towns and industries). Under these situations, "the best alternative use" needs to take into account location and hydraulic connections between users as well as the costs of transfer. Further, the opportunity cost of water used in irrigation will decline very fast after all the cost-effective possibilities of transfer have been exhausted. Given the fact that irrigation is the predominant user of water in most river basins, the opportunity cost would be zero (or close to it depending upon the ecosystem demand for water) after the demands for other sectors/users have been met. Under such a situation, the opportunity cost would have to be estimated on the basis of the weighted average of the value-in-use in different subsectors (weighted by their volume). For example, in the Subernarekha river basin, the estimated annual demands are 1,346 million cubic meters (MCM) for irrigation, 440 MCM for industry and 235 MCM for domestic users. Assuming that the entire volume of irrigation water could be transferred to industry and domestic sectors, the opportunity cost for about 50 percent of the water used in irrigation would be zero. Using these volumes and estimates of value-in-use in the industrial and domestic sectors, the opportunity cost of irrigation water is calculated as 59.5 cents/m3. This figure is much lower than the average value of water used in the industrial sector. Further, this figure is based on the assumption that as much as 440 MCM of water could be transferred out of agriculture without much of the additional costs as estimated here.
As pointed out by Olivares (1996), in Chile, the need for physical arrangements for the water transacted to be actually transferred from the seller’s outlet to the buyer’s intake is the main constraint to water transactions and thus to large scale development of water markets. In the Paloma system in Chile in 1994, transaction between canal systems amounted to 1 percent of water rights (sales) and 3 percent of available water (rentals). This underlines the need for a careful analysis of the scope of water transfers from agriculture to other uses. These issues are best handled in the framework of systems analysis.
A Comparison of Costs and Values in Various Sectors
Figure 8 gives a comparison of values and costs of water in three sectors
in the Subernarekha basin. The value of water in industrial use is
approximately six times the Full Cost of the supply of water, including
the costs of economic and environmental externalities. In contrast,
the Value-in-Use in the urban household sector is lower than the Full Costs
of supply. In the case of agriculture, the Value-in-Use is much lower
than the Full Economic Cost, which includes the opportunity costs of
water used in irrigation, which implies that under the current situation
there may be issues with sustainability, and given the very low tariffs,
there may be opportunities to use tariffs to reach a more sustainable allocation
of water.
(figures in cents per m3)
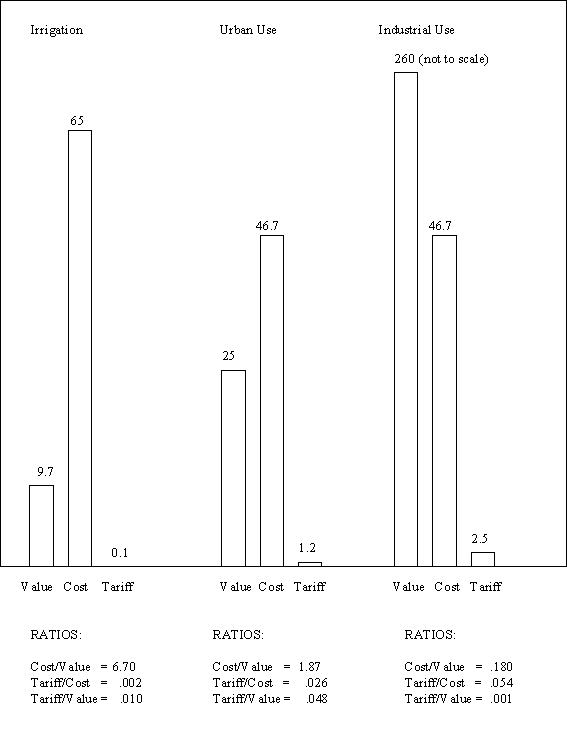
Figure 8. Comparison of Value-in-Use, Costs and Tariffs for Three Sectors in Subernarekha River Basin, India (17)
To recapitulate, this paper presents a framework for operationalizing the concept of water as a social and economic good. Four principal conclusions emerge from the discussion:
Anandalingam, G., R. Bhatia, and R. Cessti. 1991. Subernarekha Integrated Water Management Project. World Bank Final Report. Washington, D.C.
Bhatia, R. and S.K. Raheja, 1996. Multiple Uses of Water: A Research Proposal. Submitted to IIMI, Draft.
Bhatia, R. 1996. Poverty and Irrigation in India: A Review of Empirical Evidence, IIMI, Colombo, Forthcoming, October, 1996.
Bhatia, R., R. Cessti, and J. Winpenny. 1995 Water Conservation and Reallocation: Best Practices. The World Bank, Washington, DC.
Bhatia, R., P. Rogers, J. Briscoe, B. Sinha, and R. Cessti. 1994. Water Conservation and Pollution Control in Indian Industries: How to Use Water Tariffs, Pollution Tariffs and Fiscal Incentives in India. Water and Sanitation Currents, World Bank, Washington, D.C.
Bhatia, R and Malin Falkenmark. 1993. Water Resource Policies and the Urban Poor: Innovative Approaches and Policy Imperatives. Paper presented at the Dublin Conference on Water and Environment 1992. Water and Sanitation Division, World Bank.
Bhatia, R. 1989. “Financing Irrigation Services in India: A Case Sudy of Bihar and Haryana States,” in Financing Irrigation Services: A Literature Review and Selected Case Studies from Asia by L.E. Small, M.S. Adriano, E.D. Martin, R. Bhatia, Y.K. Shim and P. Pradhan. International Irrigation Management Institute, Colombo, Sri Lanka.
Billings, R.B., and W.M. Day, "Elasticity of demand for water: policy implications for southern Arizona," Arizona Review, 3:1-11, 1983.
Briscoe, J. 1997. Water as an Economic Good: the Practical Implications of Varying Environmental Conditions, draft of paper for 1997 ICID Europe Conference on “Water as an Economic Good? Oxford. 1997.
Briscoe, J. 1996. Water resources management in Chile: Lessons learned from a World Bank Study Tour, World Bank, Washington, DC. 12 pages.
Briscoe, J. 1996. “Water as an Economic Good: The Idea and What it Means in Practice,” Proceedings of the ICID World Congress, Cairo.
Briscoe, John., The German Water and Sewerage Sector: How well it Works and What this Means for Developing Countries, TWU 21, Water and Sanitation Division, The World Bank, Feb. 1995.
Briscoe, J. 1994. Implementing the new water resources policy consensus: Lessons from good and bad practices in: Putting Agenda 21 into Practice, ed. J. Lundqvist and T. Jonch-Clausen, Linkoping University, Sweden. Pp. 83-100.
Desvouges, W.H., and V. Kerry Smith, Benefit-Cost Assessment for Water
Programs, Volume I, prepared for the U.S. Environmental Protection Agency,
Research Triangle Institute, North Carolina, 1983.
Dhawan, B.D. Irrigation in India’s Agricultural Development;
1988
Chambers, R. 1988. Managing Canal Irrigation. Oxford and IBH, Delhi, India.
Cheret, I. 1994. Managing Water: The French Model, in: Valuing the Environment, World Bank, Washington, DC.
Dixon, J.A., L.F. Scura, R.A. Carpenter, and P.B. Sherman. 1994. Economic Analysis of Environmental Impacts. Earthscan Publications.
Dhawan, B.D. 1986. Output Impact According to Main Irrigation Sources: Empirical Evidence for Four Selected States, paper to Seminar on Water Management, Indian National Science Academy.
Dublin. 1992. “The Dublin Statement on Water and Sustainable Development.” Dublin International Conference on Water and the Environment. Dublin, Ireland.
Gazmuri, R. and M. Rosegrant. 1996. Chilean Water Policy: The Role of Water Rights, Institutions and Markets. Water Resources Development, Vol. 12, No. 1, pp 33-48.
Gibbons, D. C. 1986. The Economic Value of Water. Resources for the Future, Washington, DC, 101 pages.
Goodland, R. 1996. The Environmental Sustainability Challenge for the Hydro Industry. Hydropower and Dams, 1, pp 37-42.
Griffin, C., J. Briscoe, B. Singh, R. Ramasubban and R. Bhatia. 1995. Contingent Valuation and Actual Behavior: Predicting Connections to New Water Systems in Kerala, India. World Bank Economic Review, 9, 1, 373-395.
Harshadeep, N.R. 1995. “Comprehensive Multi-objective River Basin Planning: Fuzzy and Game Theoretic Approaches.” PhD Thesis, Harvard University, Massachusetts.
International Conference on Water and the Environment (The Dublin Conference). 1992. The Dublin Statement, World Meteorological Organization, Geneva.
Kijne, J. and R. Bhatia. 1994. Conflicts in Water Use: Sustainability of Irrigated Agriculture in Developing Countries. Proceedings of the Stockholm Water Symposium, Stockholm, Sweden. pp. 361-375.
Mann, P.C., Water Service: Regulation and Rate Reform, National Regulatory Research Institute, Columbus, Ohio, 1981.
Martin, W.E., H.M. Ingram, and A.H. Griffin, Saving Water in a Desert City. Washington, DC: Resources for the Future, 1984.
Mehre, S. 1976. Some Aspects of Labor Use in Indian Agriculture, Indian Journal of Agricultural Economics.
Miglino, L.C. 1984. “Industrial Wastewater Management in Metropolitan Sao Paulo.” PhD Thesis, Harvard University, Massachusetts.
Mu, X., D. Whittington, and J. Briscoe, "Modeling village water demand behavior: a discrete choice approach," Water Resources Research, Vol. 26, No. 4, pp. 521-529, April 1990.
OECD, Environmental Policy: How to Apply Economic Instruments, The Organization for Economic Cooperation and Development, Paris, 1991.
Olivares, Jose: Study Tour Brief: Water Markets in Chile, Water Notes, Water Resources Newsletter, The World Bank, Spring 1996.
O’Connor, David: Applying Economic Instruments in Developing Countries: From Theory to Implementation, OECD, May 1996 (Draft)
Patmasiriwat, D. et.al.. 1995. Full Cost Water and Wastewater Pricing: A Case Study of Phuket, Thailand. Thailand Development Research Institute.
Pearce, D.W. 1976. Environmental Economics. Longman, 1976.
Potier, Michel., China Charges for Pollution, The OECD Observer, The Organization for Economic Cooperation and Development, Paris, pp. 18-22, Feb/Mar 1995.
Repetto, R.: The “Second India” Revisited: Population, Poverty, and Environmental Stress over Two Decades; World Resources Institute, August 1994
Rogers, P. and N. Harshadeep. 1996. “Industry and Water: Options for Management and Conservation,” draft report submitted to the United Nations Industrial Development Organization (UNIDO), Vienna, Austria.
Seckler, D. 1996. New Era in Water Management. IIMI, Colombo.
Serageldin, Ismail: Toward Sustainable Mangement of Water Resources; the World Bank, 1995
Shah, T. 1993. Groundwater Markets and Irrigation Development: Political Economy and Practical Policy. Oxford University Press, New Delhi.
Sinha, B. and Ramesh Bhatia. 1992. Economic Appraisal of Irrigation Projects in India. Agricole Publishing Academy, New Delhi.
Rogers, P. 1986. “Water: Not as Cheap as you Think.” Technology Review. 89:8, pp. 30-43.
Rogers, P. 1992. Comprehensive Water Resources Management: A Concept Paper. World Bank, Infrastructure and Urban Development Department, WPS *&(, 1992.
Rogers, P. and N. Harshadeep. 1996. "Industry and Water: Options for Management and Conservation," draft report submitted to the United Nations Industrial Development Organization (UNIDO), Vienna, Austria.
Shah, T. 1993. Groundwater Markets and Irrigation Development: Political Economy and Practical Policy, Oxford University Press, New Delhi.
Silliman, J. And R. Lenton. 1983. Irrigation and the Land Poor, paper to the International Conference on Water, Food and Land, Texas A&M University, Texas, May, 1983
Vaidyanathan, A. 1993. Second India Series Revisited: Water. Madras Institute of Development Studies; Madras, India.
Whittington, D., J. Briscoe, and X. Mu. 1987. “Willingness to Pay for Water in Rural Areas: Methodological Approaches and an Application in Haiti.” WASH Project, Field Report No. 213, Washington, D.C.
Whittington, D., D. Lauria, and X. Mu. 1989. “Paying for Urban Services: A Study of Water Vending and Willingness to Pay for Water in Onitsha, Nigeria.” The World Bank, Report INU 40, Washington, D.C.
Winpenny, J.T. 1991. Values for the Environment: A Guide to Economic Appraisal. Her Majesty’s Stationery Office, London.
World Bank. 1993. Water Resources Management. A World Bank Policy Paper. Washington, DC.
World Bank Water Demand Research Team. 1993. The Demand for Water in Rural Areas: Determinants and Policy Implications. World Bank Research Observer 8(1), 47-70.
World Bank. 1995. The Word Bank and Irrigation. A World Bank Operations Evaluation Study, Washington, DC.
World Bank : Azerbaijan: Baku Water Supply Rehabilitation Project, May
1995